
Keeping crude oil flowing through production and transportation systems is one of the central problems of flow assurance, and it depends on how fluid composition, flow regime, and thermal conditions interact.
Wax deposition may occur when the temperature of the fluid drops below the Cloud Point or Wax Appearance Temperature (WAT), which is defined as the temperature at which the first paraffin crystal forms. Multiple experimental methods exist for measuring WAT: Differential Scanning Calorimetry, Ultrasonic Methods, Cross-Polar Microscopy, and Cross-Polarization Translucency, to name a few. However, WAT measurements depend on the methodology and the sample cooling rate: the faster the cooling rate, the lower the measured WAT, because nucleation is delayed and the system subcools before the first stable crystals form.
Formation of wax deposits is reversible, and the temperature at which the last precipitated paraffin redissolves in the oil is known as the Wax Disappearance Temperature (WDT). The literature on experimental studies regarding WDT measurements is limited. This study closes part of the gap by measuring how the heating rate affects the measured WDT.
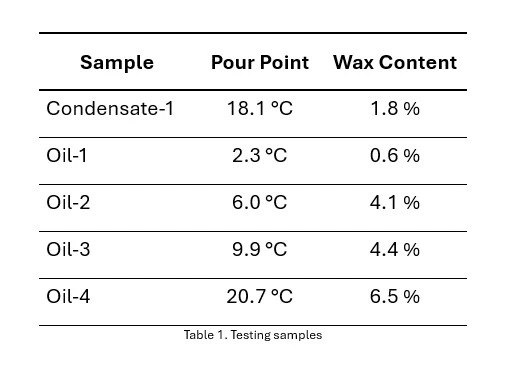
For this study, the WAT and WDT of one condensate and four oil samples with different wax contents were measured using the Optical WAT Detector (OWD) developed by PSL Systemtechnik, Germany. The key features of this device are that it allows precise control of both heating and cooling and does not require a minimum heating or cooling rate, unlike the Differential Scanning Calorimetry method. Additionally, the OWD runs as a fully automated process, preventing measurements from being biased by subjective perception.
The measurement principle of the Optical WAT Detector (OWD) is the Cross-Polarization Translucency (CPT) method, which relies on the ability of hydrocarbon crystals to rotate the polarization plane of light passing through the wax crystal; these changes are recorded as the WAT or the WDT, depending on whether the sample is being cooled or heated. Figure 1 shows a schematic of the OWD.
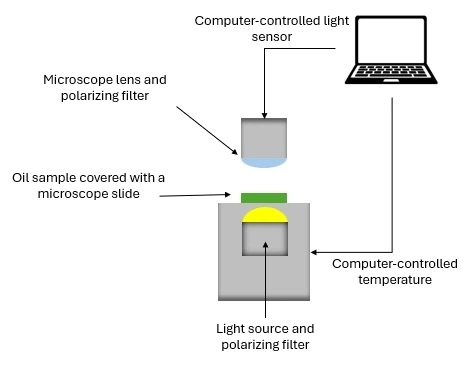
The OWD uses two polarizing filters, crossed at 90° to each other, with the sample in between.
When the sample is fully liquid, light from the source is polarized by the first filter, passes straight through the liquid oil, and then hits the second filter, which is rotated by 90°, blocking the polarized light so the sensor at the top does not detect anything.
As the sample cools down and the first wax crystals form, they reorient the plane of polarization of the light passing through them. Now, a portion of the light is rotated enough to pass through the second filter and reach the sensor. The associated jump in the signal is what the instrument registers as the WAT.
During heating, the process runs in reverse: as crystals melt, less light is reoriented, and the signal returns to baseline. The temperature at which it returns to zero is the WDT of the sample.
The present study systematically varied the heating and cooling rates (0.10, 0.25, 0.50, 1.0, 2.0 °C/min) for the five samples to measure their respective WAT and WDT.
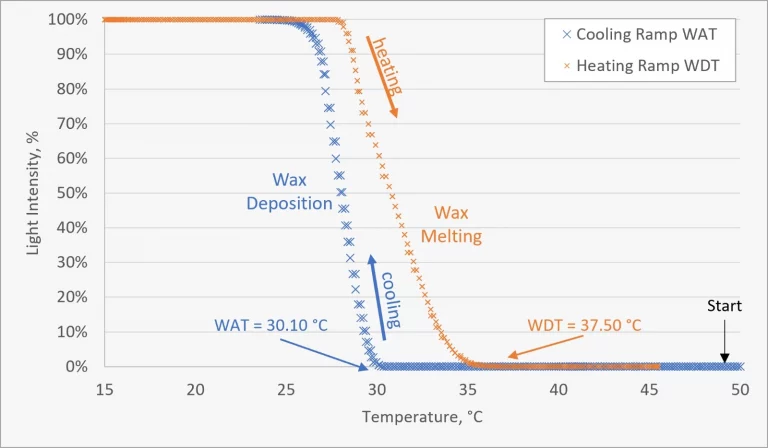
Using Oil-2 as an example (Figure 2), the experiment starts at 50 °C, where the sample is fully liquid, the light intensity detected by the OWD is zero, and no polarized light reaches the sensor.
The device cools the sample down at 2 °C/min. Following the blue curve to the left, the signal remains at zero until it suddenly increases; the temperature at which the signal increases is where the first wax crystals formed and reoriented the polarized light, which, by definition, is the WAT. The sample was further cooled down, inducing extensive wax crystallization. The process was then run in reverse. The orange curve shows the heating ramp at 2 °C/min. As the wax melts, the signal gradually decreases to baseline. The point where it returns to zero is the WDT.
The same experimental process was repeated for the other thermal rates (0.10, 0.25, 0.50, and 1.0 °C/min) and for all samples.
When plotting the result for the WAT and WDT measurements at different thermal rates for Oil-2 (Figure 3), we can make two main observations:
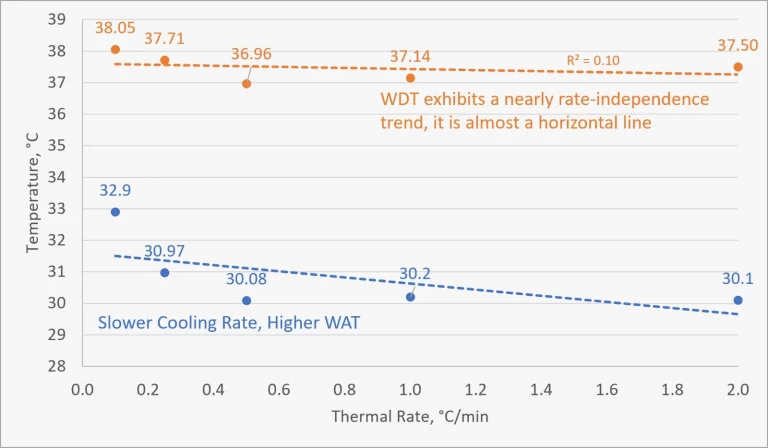
The experimental results may be explained by the fact that the crystallization process requires the organization of molecules into so-called nuclei, the first crystals formed during cooling. The process is governed by an energy barrier that must be overcome to reach a higher state of order, but forming crystals also requires time to arrange the molecules in a specific pattern. Once the first stable crystals form, the subsequent molecules are quickly organized according to the given crystal structure, making the WAT rate-dependent.
On the other hand, WDT is measured during heating; existing crystals are continuously dissolved. There is no energy barrier to cross; dissolution is a purely thermodynamic process. Once the temperature reaches the liquidus point, the last crystal can melt without delay. That is why WDT is nearly rate-independent.
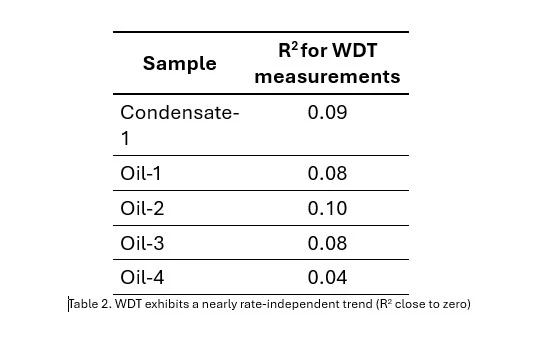
The other samples corroborated these findings. Across all five samples, tested at five thermal rates and with different wax contents, WDT was nearly independent of the heating rate in all cases. Table 2 shows the R2 for the linear regression of the WDT measured at the five thermal rates for each sample.

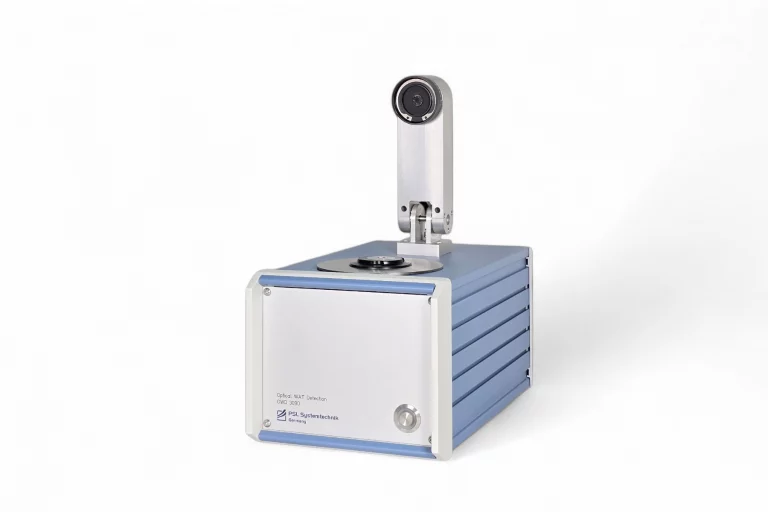
The Optical WAT Detector is a compact, all-in-one solution for determining the wax appearance temperature (WAT) and detecting solids. With highly sensitive optics, integrated temperature control, and automated measurement procedures, it delivers precise results both in the laboratory and directly on-site.

Don’t miss any more PSL news and secure exclusive benefits!
We provide you with important updates.
You need to load content from reCAPTCHA to submit the form. Please note that doing so will share data with third-party providers.
More InformationYou need to load content from Turnstile to submit the form. Please note that doing so will share data with third-party providers.
More InformationYou are currently viewing a placeholder content from Vimeo. To access the actual content, click the button below. Please note that doing so will share data with third-party providers.
More InformationYou are currently viewing a placeholder content from YouTube. To access the actual content, click the button below. Please note that doing so will share data with third-party providers.
More InformationYou need to load content from reCAPTCHA to submit the form. Please note that doing so will share data with third-party providers.
More InformationYou are currently viewing a placeholder content from TrustIndex. To access the actual content, click the button below. Please note that doing so will share data with third-party providers.
More Information